E-commerce Sales Dashboard (Amazon Data)
Developing an interactive Tableau dashboard to visualize and analyze over $2.41 billion in Amazon sales data, enabling KPI tracking and product performance insights.
Problem Statement
- Amazon's global sales have shown a significant downward trend since 2012, with revenue declining from a peak of $535M to just $152M in 2017
- Order volume has decreased by 77% from 2012 (396 orders) to 2017 (90 orders)
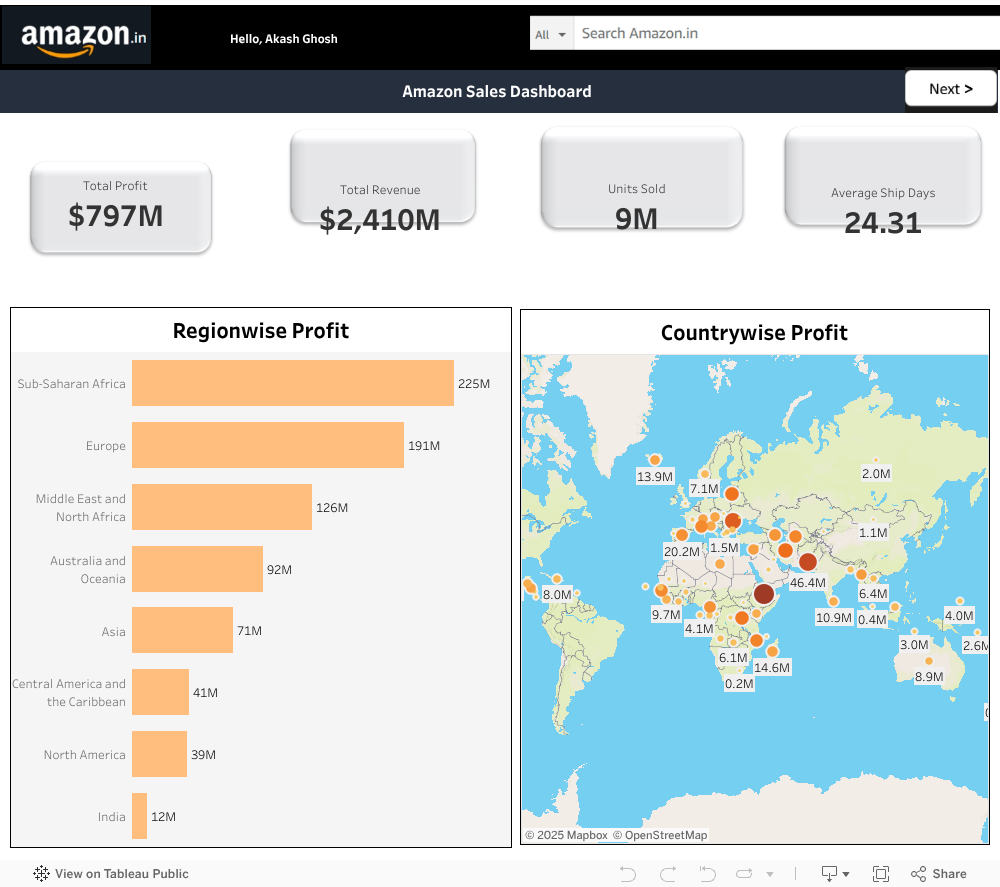
- Despite total revenue of $2,410M, profitability challenges exist with only $797M in total profit (33% profit margin)
- India accounts for only $12M profit, the lowest among all regions despite being the home market for amazon.in.
- Shipping efficiency does not correlate with revenue performance
Solution & Key Insights
An interactive dashboard was created using Tableau, connecting to the processed Amazon sales dataset. Key features and insights derived include:
- Revenue Channel Opportunity: Offline sales ($1,425.39M) represent 59.15% of revenue compared to online sales ($984.28M), suggesting potential for digital transformation
- Regional Performance: Sub-Saharan Africa ($225M) and Europe ($191M) are top profit-generating regions, while North America ($39M) and India ($12M) underperform
- Product Category Focus: Cosmetics leads in revenue ($724M), profit ($288M), and order volume (261), with the highest profit margin at 39.8%
- Priority Distribution: High priority orders (522) exceed Critical orders (378), suggesting possible misalignment in prioritization strategy
- Cost Structure: Highest costs are in Cosmetics ($436M) and Office Supplies ($353M), indicating areas for potential cost optimization
- Profit Efficiency: Household products generate the second-highest profit ($117M) despite not being in the top two for revenue
- Shipping Performance: Average shipping time of 24.31 days is high, potentially impacting customer satisfaction
Conclusion & Impact
The dashboard reveals Amazon's significant market challenges from 2012-2017, with a 72% revenue decline and similar drops in shipment and order volumes. Despite these challenges, the company maintains a 33% overall profit margin. The strong performance in Sub-Saharan Africa and Europe suggests opportunities for regional best practice sharing. Cosmetics emerges as the star product category with high volume, revenue, and profit margins, while the offline sales channel dominates revenue contribution. To reverse the negative trend, Amazon should focus on growing its online channel, optimizing operations in underperforming regions (especially North America and India), reducing shipping times, and leveraging insights from high-margin categories like Cosmetics and Household products to improve overall profitability.
Live Dashboard (Tableau)
Note: Loading the interactive dashboard may take a few moments.