E-Commerce Revenue Analytics Dashboard
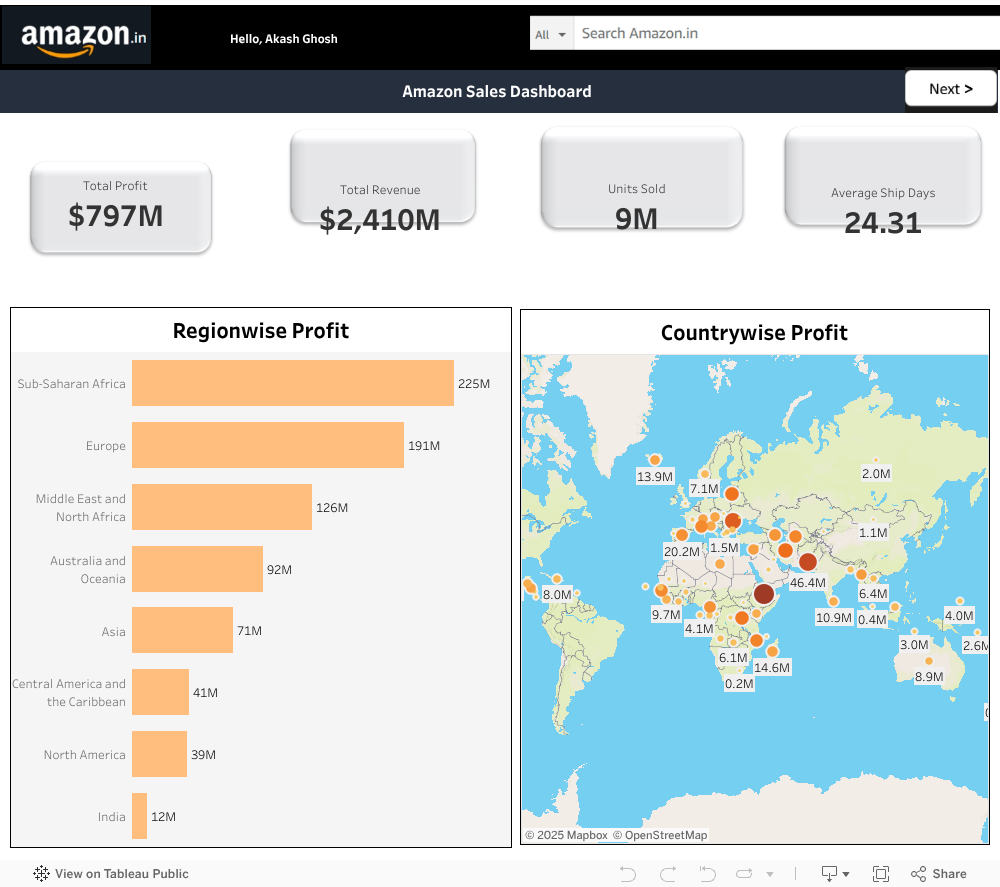
Built a Tableau dashboard consolidating $2.41B in revenue across 8 regions, replacing disconnected reports that caused conflicting numbers. Added customer segmentation and time-series views that cut strategic planning cycle time by 25%.
Problem Statement
Amazon global sales showed a steep downward trend from a peak of $535M (2012) to $152M (2017) — a 72% decline. Order volume dropped 77% from 396 to 90. Revenue of $2.41B but only $797M profit (33% margin). India generated only $12M profit (lowest globally). Disconnected reports caused conflicting numbers in executive meetings.
Solution & Key Insights
- Offline sales ($1,425.39M / 59.15%) dominate online sales ($984.28M) — major potential for digital expansion
- Sub-Saharan Africa ($225M) and Europe ($191M) lead in profit; North America ($39M) and India ($12M) lag behind
- Cosmetics was the top performer: Revenue $724M, Profit $288M, 261 orders, 39.8% margin
- Added customer segmentation and time-series views that cut strategic planning cycle time by 25% and improved forecasting accuracy
- Average shipping duration of 24.31 days — operational bottleneck identified
- Channel breakdown enabled strategic planning for digital expansion
Conclusion & Impact
Strategic action plan to grow online channels, transfer best practices from Europe/Africa to NA/India, streamline shipping velocity, and optimize inventory toward Cosmetics and Household goods.
Interactive Dashboard